Global Climate Change Visuals
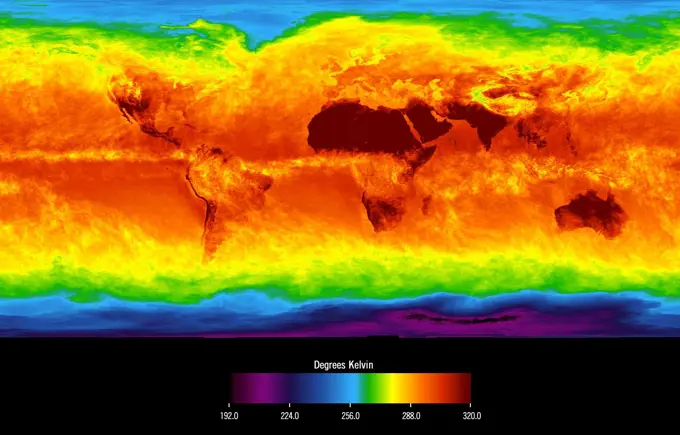
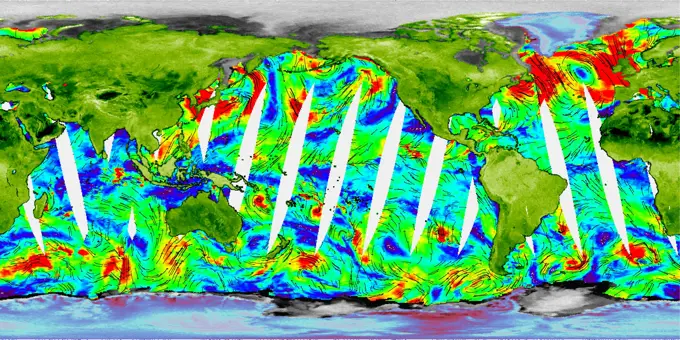
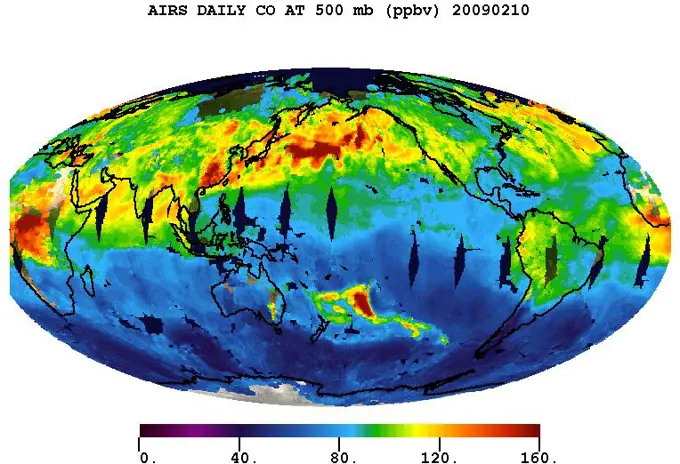
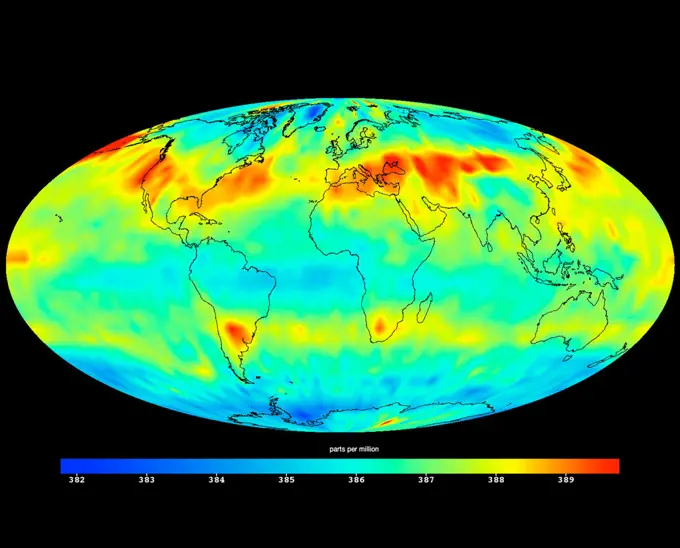
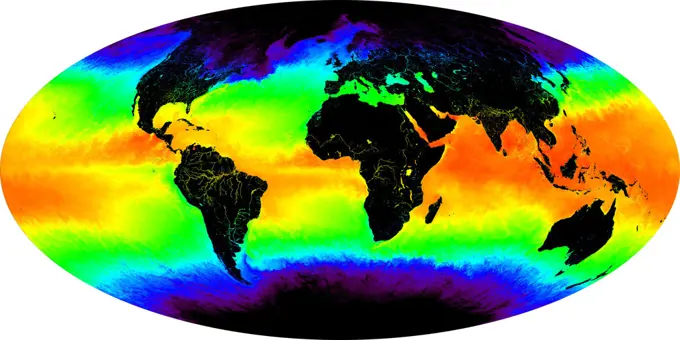
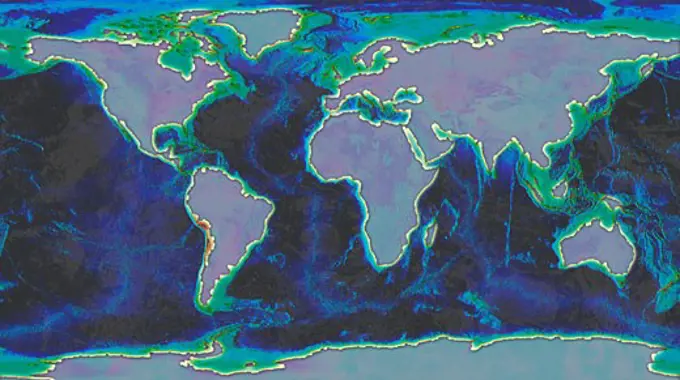
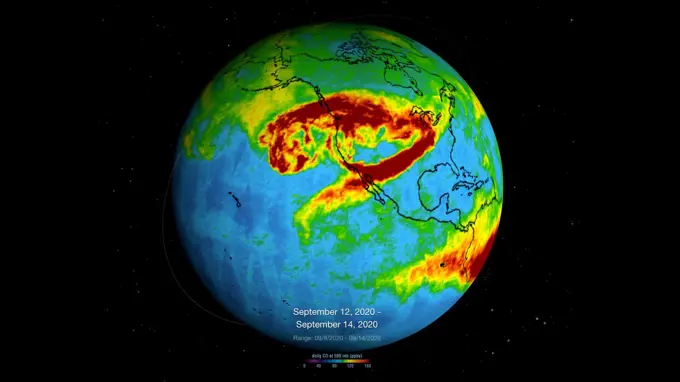
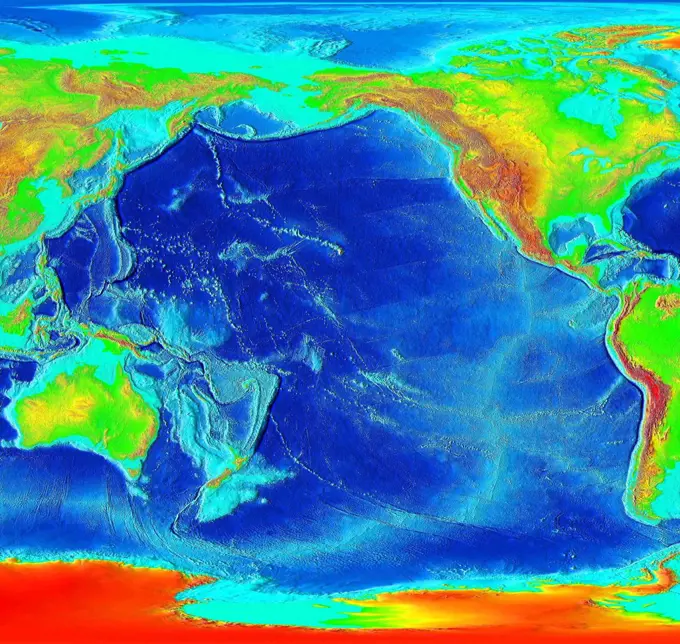
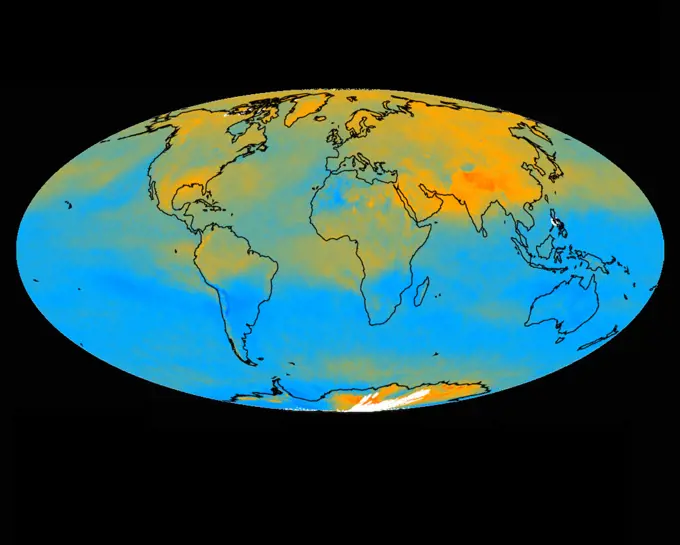
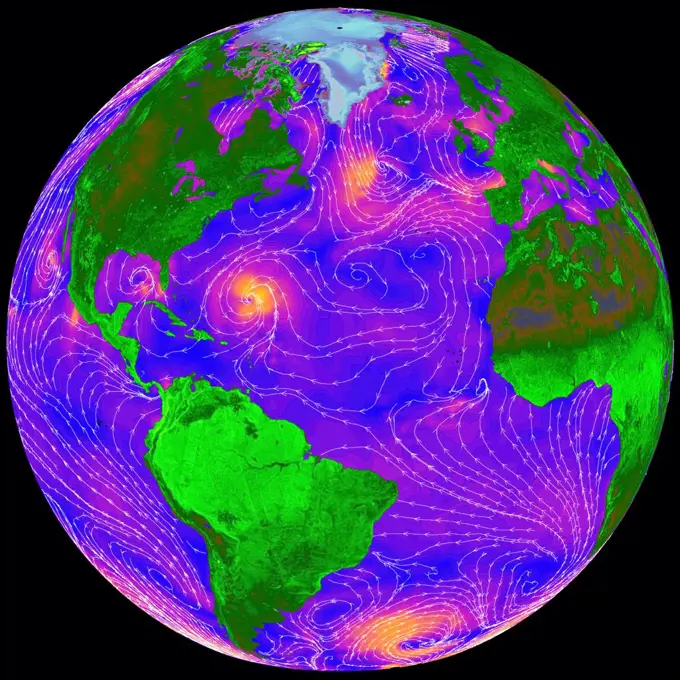
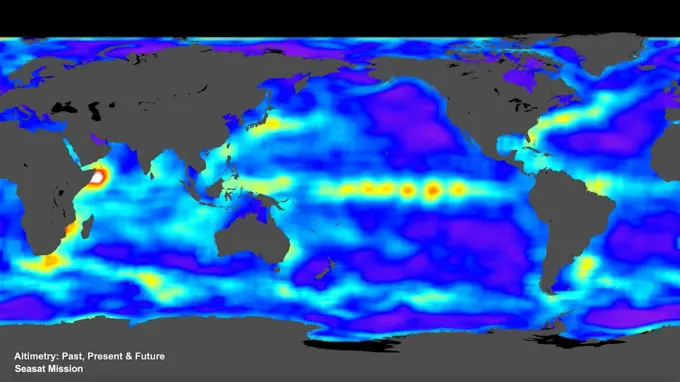
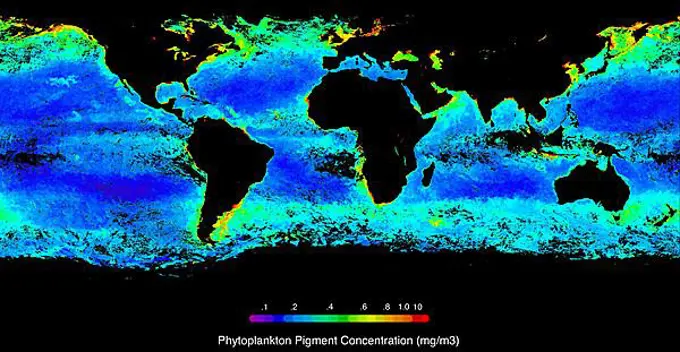
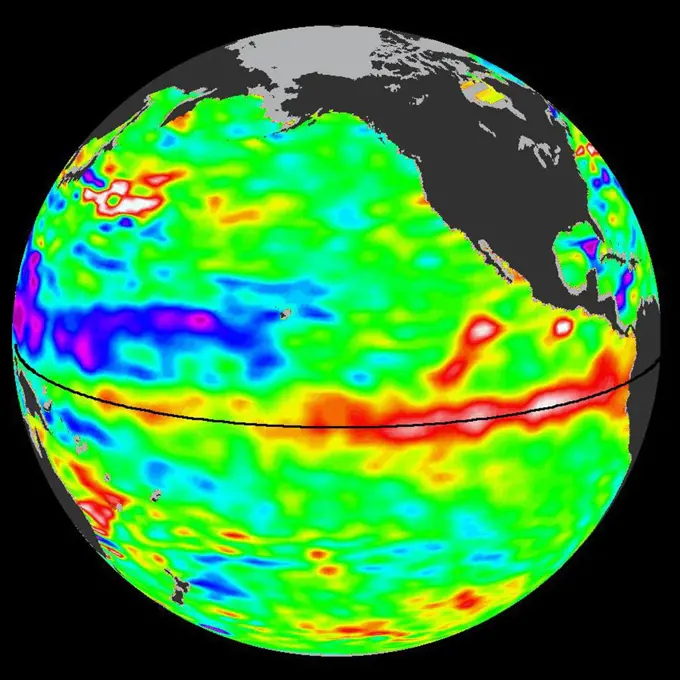
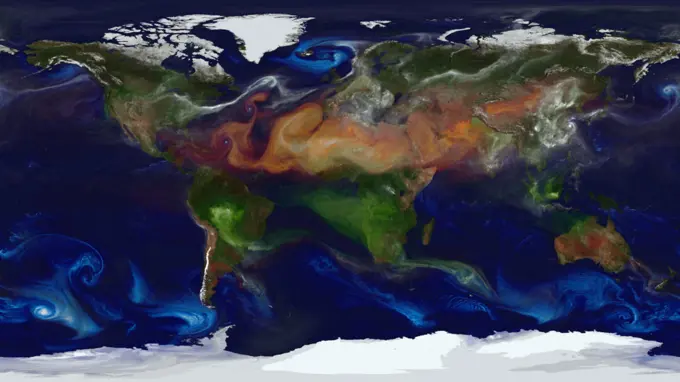
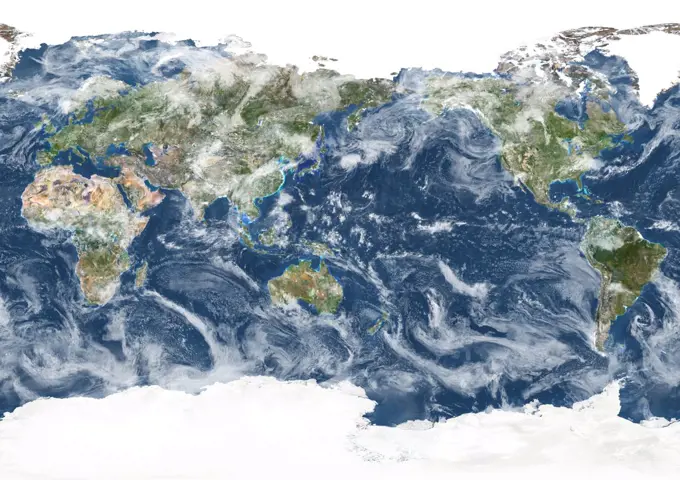
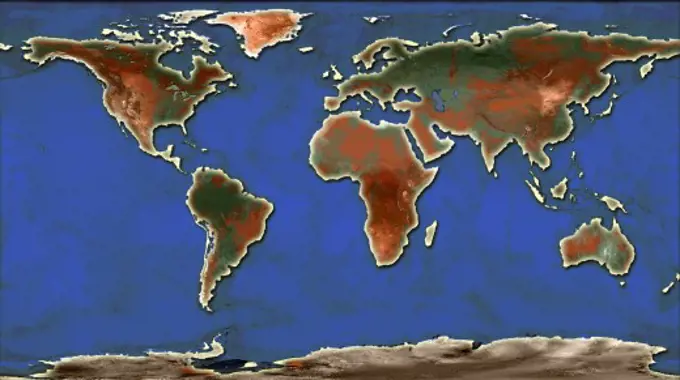
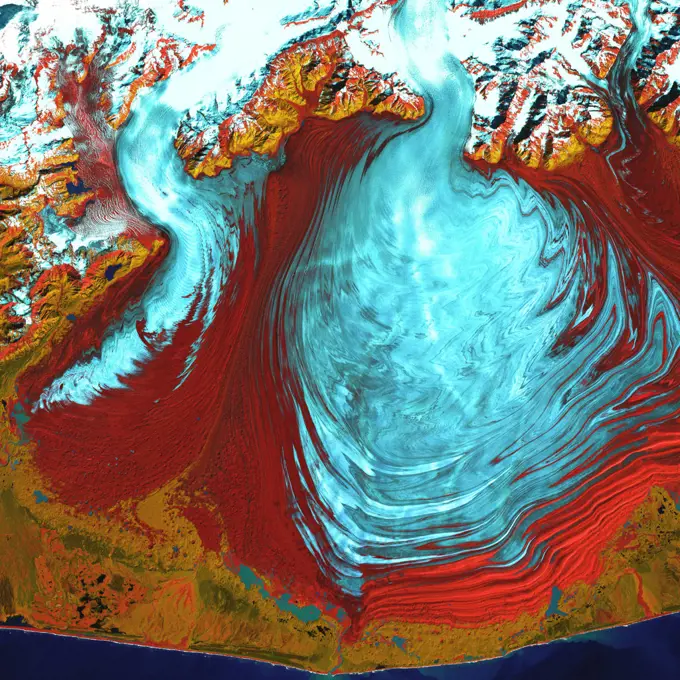
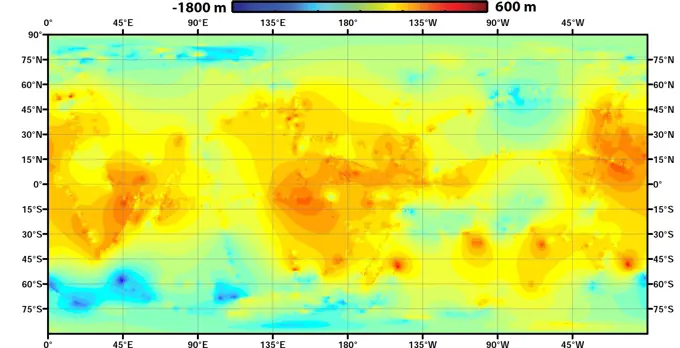
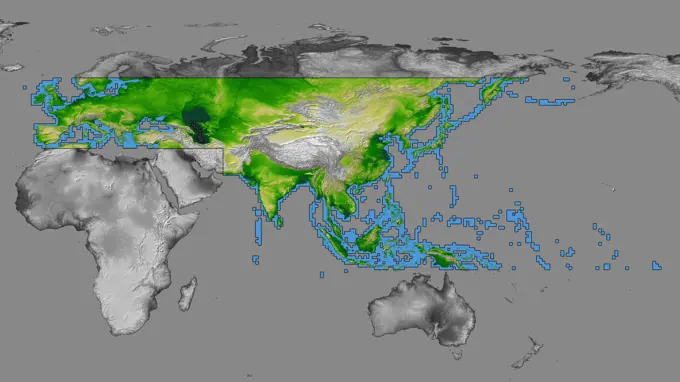
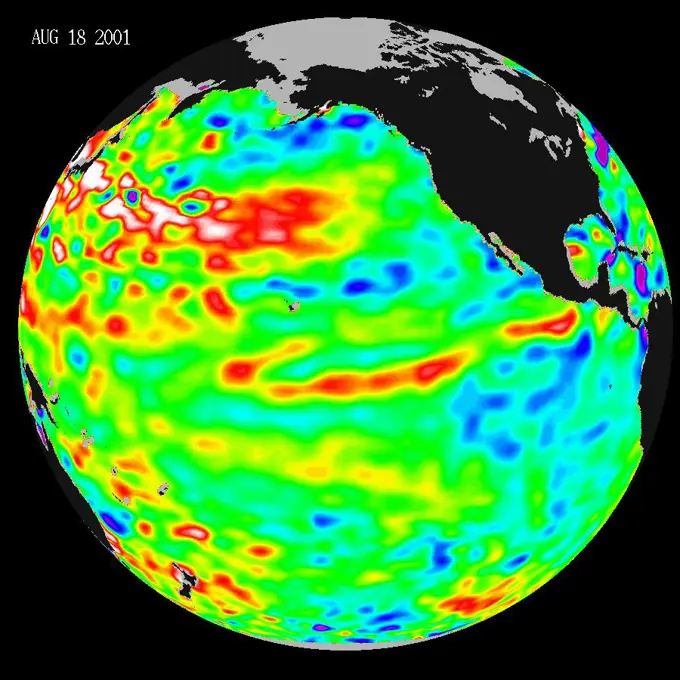
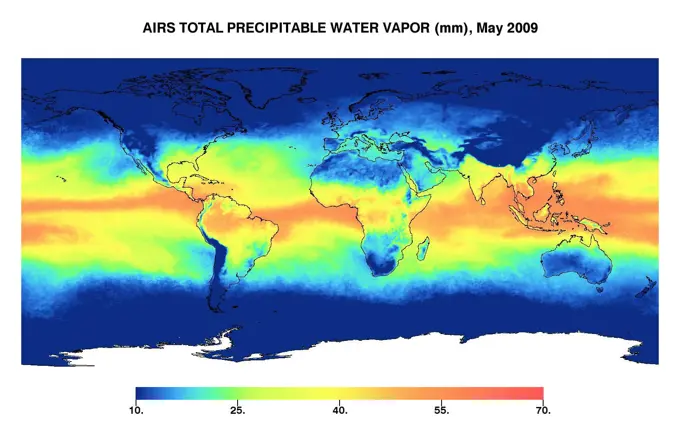
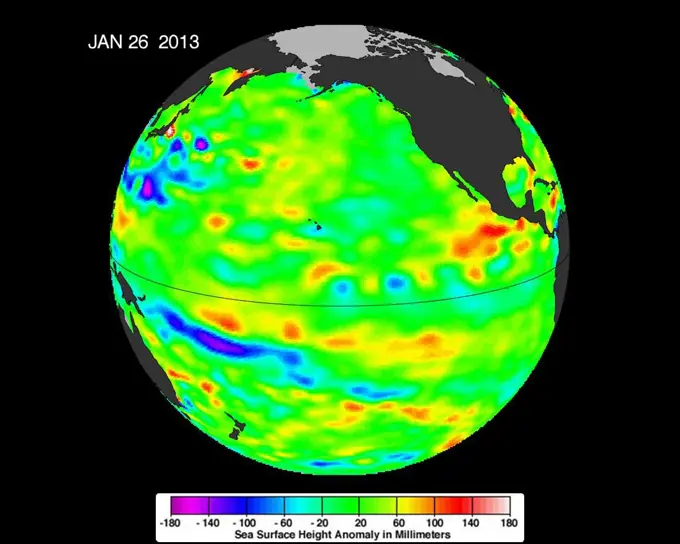
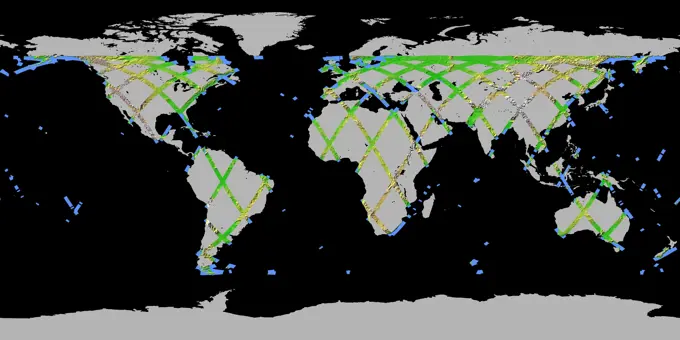
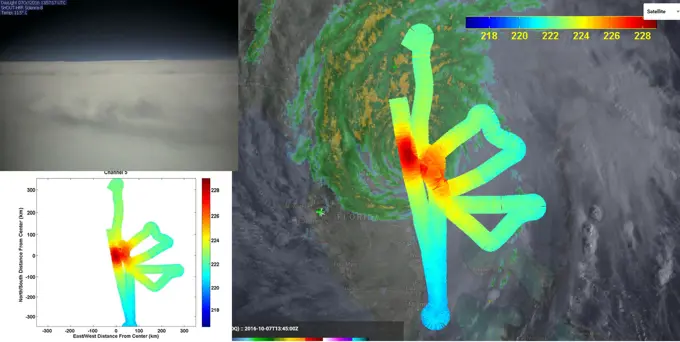
Vivid images depicting ocean temperatures, carbon concentrations, and climate change impacts on Earth from space.

Vivid images depicting ocean temperatures, carbon concentrations, and climate change impacts on Earth from space.