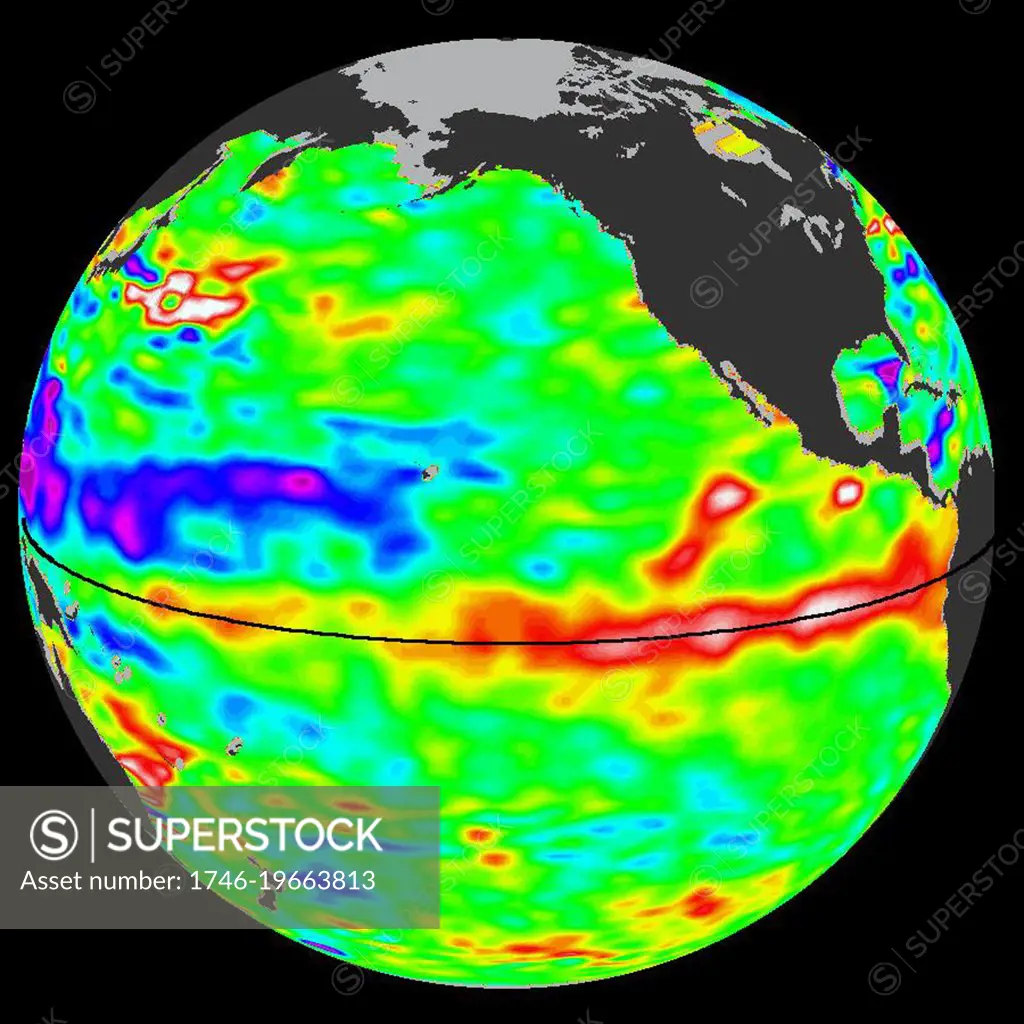
Sea-level height data from the NASA/European Ocean Surface Topography Mission/Jason-2 oceanography satellite December 1, 2009 It shows a red and white area in the central and eastern equatorial Pacific that is about 10 to 18 centimetres (4 to 7 inches) above normal. These regions contrast with the western equatorial Pacific, where lower than-normal sea levels (blue and purple areas) are between 8 to 15 centimetres (3 and 6 inches) below normal. Along the equator, the red and white colours depict areas where sea surface temperatures are more than one to two degrees Celsius above normal (two to four degrees Fahrenheit).
SuperStock offers millions of photos, videos, and stock assets to creatives around the world. This image of Sea-level height data from the NASA/European Ocean Surface Topography Mission/Jason-2 oceanography satellite December 1, 2009 It shows a red and white area in the central and eastern equatorial Pacific that is about 10 to 18 centimetres (4 to 7 inches) above normal. These regions contrast with the western equatorial Pacific, where lower than-normal sea levels (blue and purple areas) are between 8 to 15 centimetres (3 and 6 inches) below normal. Along the equator, the red and white colours depict areas where sea surface temperatures are more than one to two degrees Celsius above normal (two to four degrees Fahrenheit). by World History Archive/Image Asset Management is available for licensing today.
Looking for a license?
Click here, and we'll help you find it! Questions? Just ask!
Click here, and we'll help you find it! Questions? Just ask!
DETAILS
Image Number: 1746-19663813Rights ManagedCredit Line:World History Archive/Image Asset Management/SuperStockCollection:Image Asset Management Contributor:World History Archive Model Release:NoProperty Release:NoResolution:4300×4300