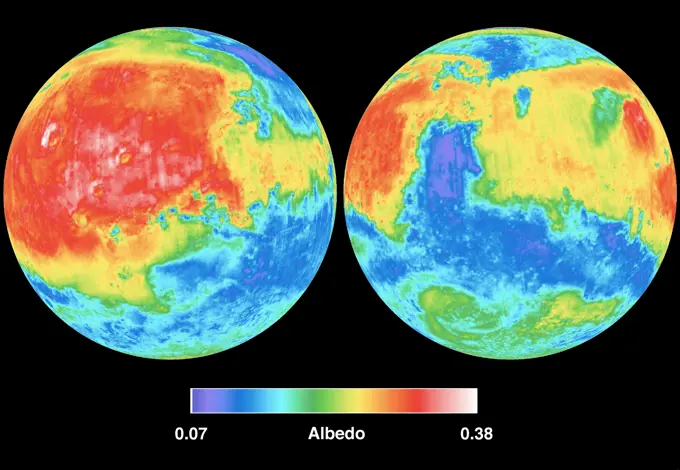
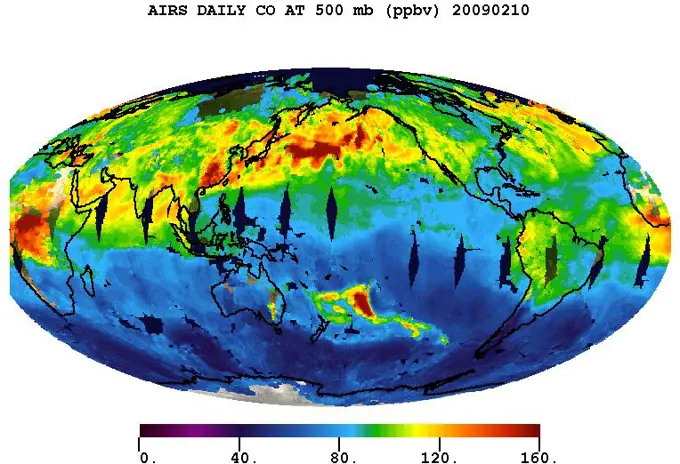
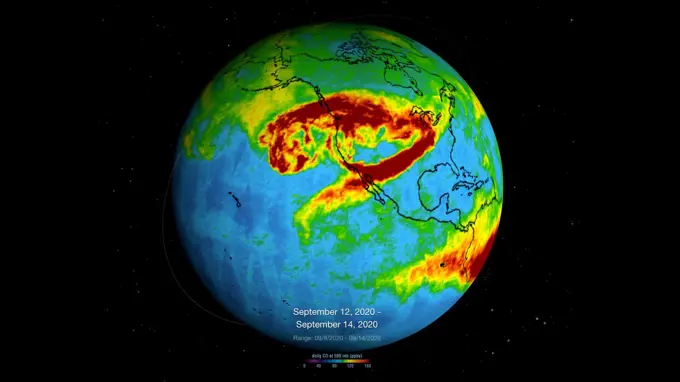
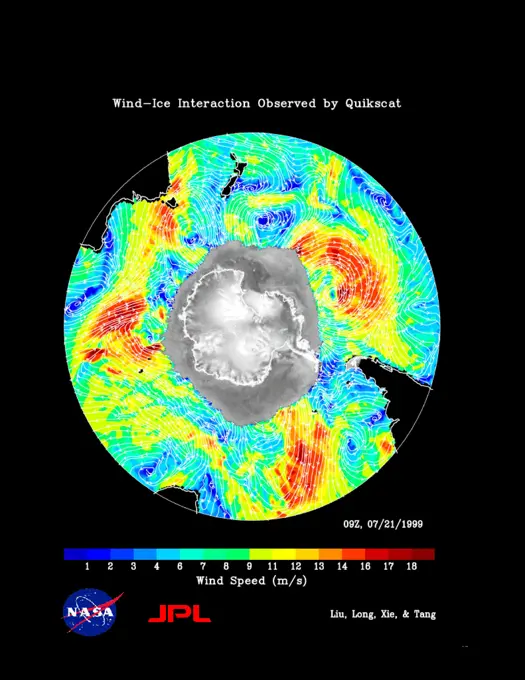
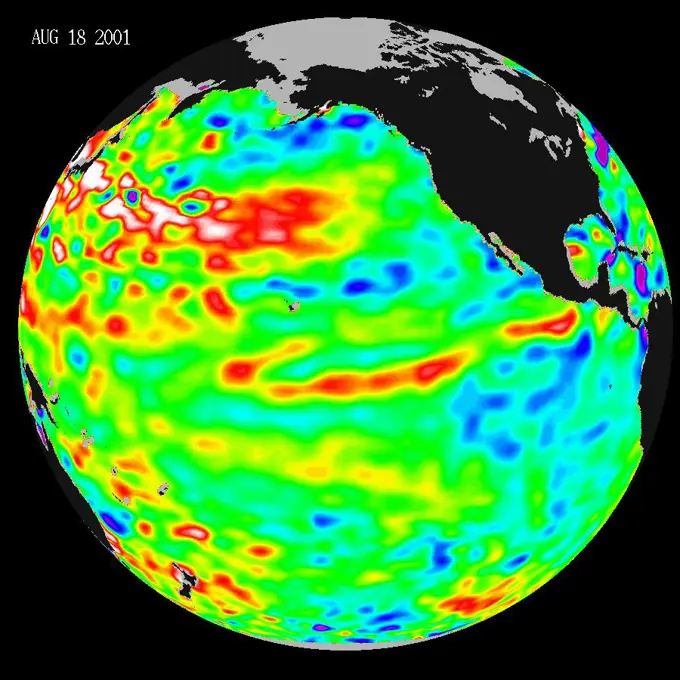
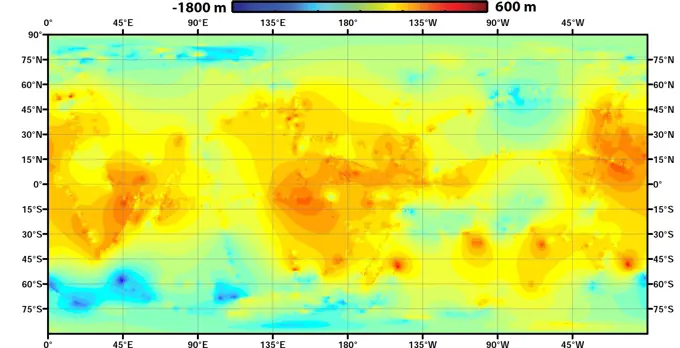
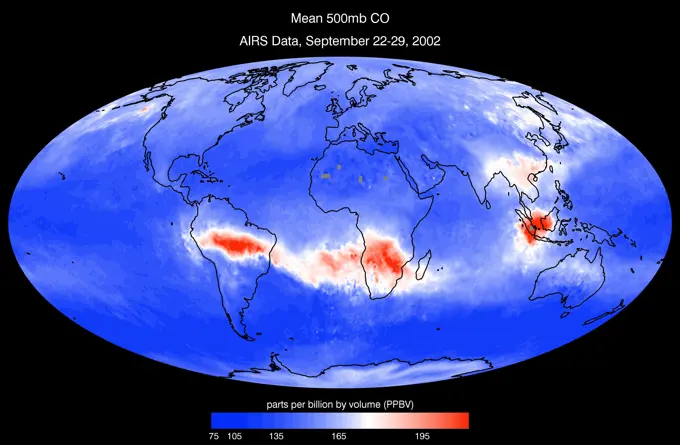
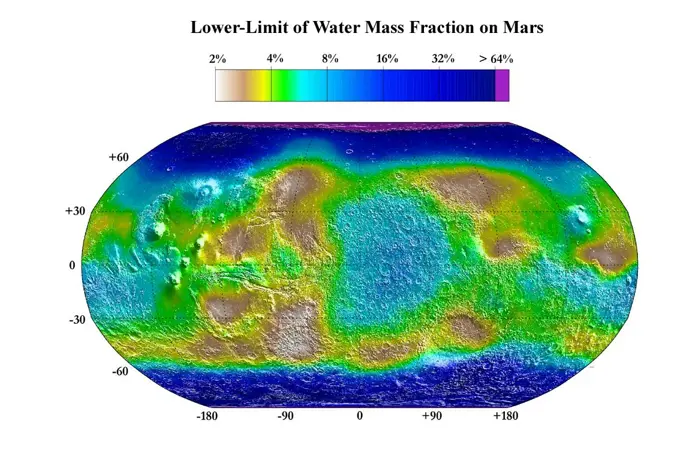
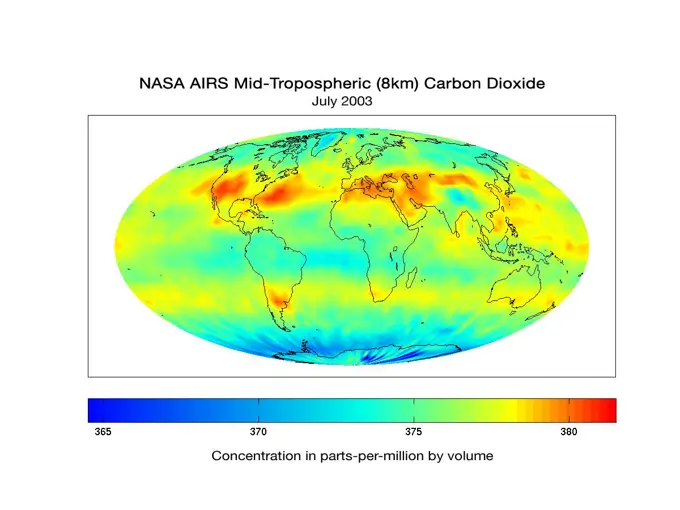
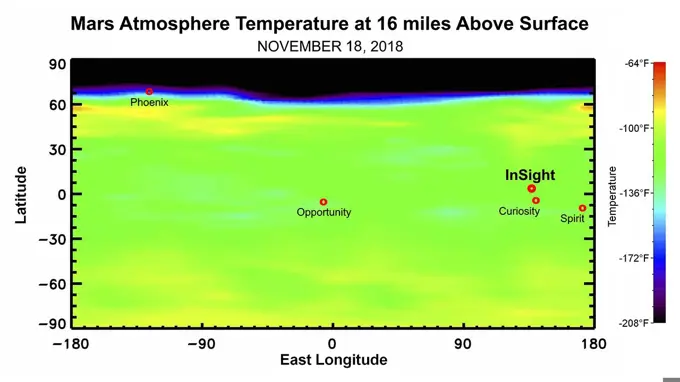
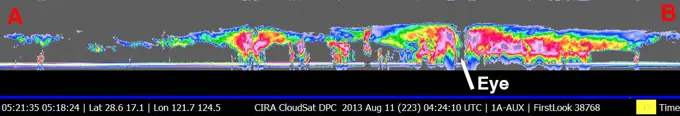
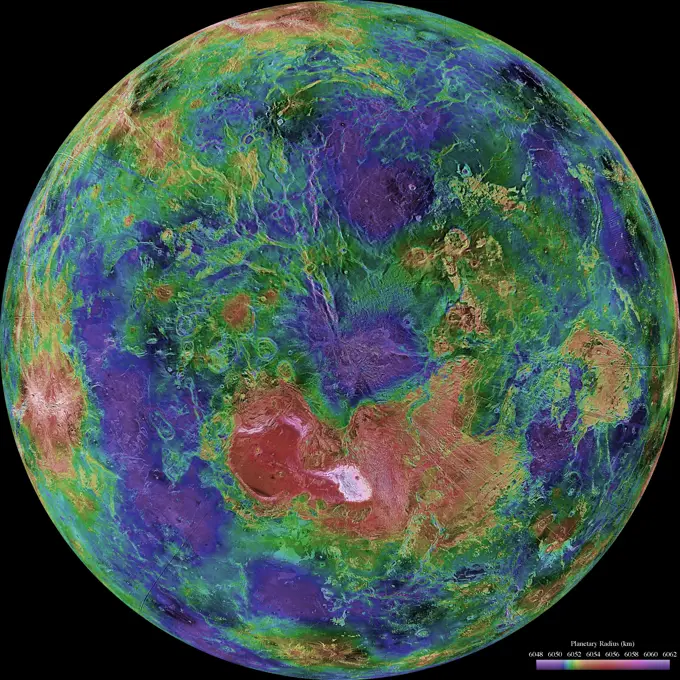
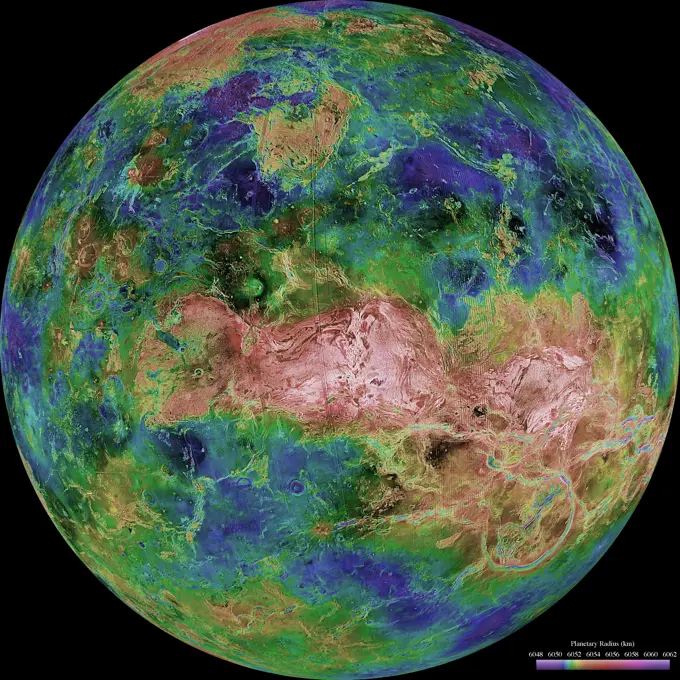
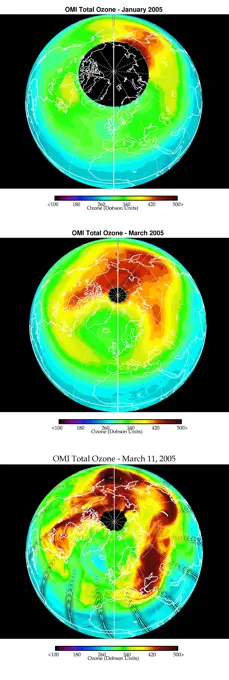
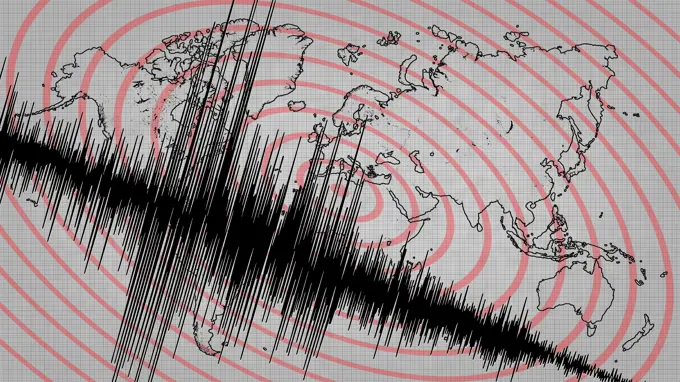
Fine ArtVintageFootageSubscriptionBoardsFree ResearchPricing
  • Fine Art
  • Vintage
  • Footage
  • Subscription
  • Boards
  • Free Research
  • Pricing

Atmospheric Science Visualizations

Colorful satellite imagery depicting carbon monoxide from fires, water vapor, and seismic activity, showcasing global environmental monitoring.

Mars Albedo
Mars Albedo
91 assets in this story
6145-44751273
Carbon monoxide from the Australian fires of February, 2009, as seen by the Atmospheric Infrared Sounder (AIRS) on NASA's Aqua satellite.
6145-44711882
Global Views of Atmospheric Water Vapor:<br />First Data from OSTM/Jason-2's Advanced Microwave Radiometer
6145-44636687
This illustration depicts synthetic aperature radar patterns of seismic deformations associated with a model earthquake on the San Francisco section of the San Andreas Fault (depicted in yellow).
6145-58972038
NASA's Atmospheric Infrared Sounder (AIRS), which is aboard the Aqua satellite, captured carbon monoxide plumes coming from California wildfires last week. There were 28 major wildfires burning across the state as of Sept. 14. This includes the August Complex Fire, which started on Aug. 17 and has since burned over 471,000 acres, making it the largest fire on record in California. The animation shows three-day averages of carbon monoxide concentrations around 3 miles (5 kilometers) up in the atmosphere between Sept. 6 and 14. The red and orange areas indicate regions with extremely high carbon monoxide concentrations of greater than 350 parts per billion by volume (ppbv). The more normal, background concentrations of carbon monoxide show up as yellow and green, with amounts between 30 and 50 ppbv. A pollutant that can travel large distances, carbon monoxide can persist in the atmosphere for about a month. At the high altitude mapped in these images, the gas has little effect on the air
6145-44505074
The figure demonstrates of the capability of the SeaWinds instrument on NASA's QuikScat satellite in monitoring both sea ice and ocean surface wind, thus helping to further our knowledge in wind-ice interaction and its effect on climate change.
6145-45012855
NASA's Aquarius instrument has produced its first global map of the salinity, or saltiness, of Earth's ocean surface, providing an early glimpse of the mission's anticipated discoveries.
6145-44557577
These images of the Pacific Ocean near Indonesia were produced using sea surface height measurements taken by NASA's U.S.-French TOPEX/Poseidon satellite.
6145-44516372
Mars Albedo
6145-44528952
These data, taken during a 10-day collection cycle ending August 18, 2001, show that above-normal sea-surface heights and warmer ocean temperatures still blanket the far-western tropical Pacific and much of the north (and south) mid-Pacific.
6145-44516374
Mars Thermal Inertia
6177-V53546291
6145-44960489
Using data from NASA's Cassini spacecraft, scientists have created the first global topographic map of Saturn's moon Titan, giving researchers a 3-D tool for learning more about one of the most Earthlike and interesting worlds in the solar system.
6145-44700435
AIRS mean carbon monoxide at 500 millibar, September 22-29, 2002 AIRS Mean Carbon Monoxide at 500 Millibar, September 22-29, 2002.
6177-V53547183
6145-44605654
Water Mass Map from Neutron Spectrometer
6145-44826500
NASA's Aqua spacecraft tracked the concentration and transport of carbon monoxide from Russian fires in 2010, during which time some 558 fires were burning.
6145-44675645
AIRS mid-tropospheric CO2, Version 5, July 2003 from the Atmospheric Infrared Sounder (AIRS) on NASA's Aqua satellite.
6145-44619104
Recent sea level height data from NASA's U.S./France Jason altimetric satellite during a 10-day cycle ending June 15, 2004.
6145-44979767
Satellite images obtained from NASA's Atmospheric Infrared Sounder (AIRS) instrument aboard NASA's Aqua spacecraft provide a glimpse into one of the most powerful storms ever recorded on Earth, Typhoon Haiyan.
6145-45111903
This map shows the frequency of carbon dioxide frost's presence at sunrise on Mars, as a percentage of days year-round, based on data from NASA's Mars Reconnaissance Orbiter.
6145-44535678
These data products from NASA's Terra satellite document the presence of airborne particulates on March 13, 2002, during Terra orbit 11880. At least once a year for a period lasting from a week to several months, northern Sumatra is obscured by smoke and
6145-44659730
In September 2006, NASA satellite data indicated that El Nio had returned to the tropical Pacific Ocean, although it was relatively weak.
6145-44625622
Recent sea-level height data from NASA's U.S./France Jason altimetric satellite during a 10-day cycle ending November 15, 2004.
6145-44693589
This visualization of a gravity model was created with data from NASAs Gravity Recovery and Climate Experiment and shows variations in the gravity field across Africa and Europe.
6145-44845770
The Atmospheric Infrared Sounder (AIRS) instrument onboard NASA's Aqua spacecraft captured this infrared image of Tropical Cyclone Yasi on Feb. 2, 2011 as the storm passed over Australia's Great Dividing Range.
6145-44557679
This image of the Pacific Ocean was produced using sea surface height measurements taken by NASA's U.S./French TOPEX/POSEIDON satellite.
6145-45116987
At 11:29 p.m. PDT on Oct. 6 (2:29 a.m. EDT on Oct. 7), NASA's Atmospheric Infrared Sounder (AIRS) instrument on NASA's Aqua satellite produced this false-color infrared image of Matthew as the storm moved up Florida's central coast.
6145-44607251
SRTM Data Release for Eurasia, Index Map and Colored Height
6145-44587877
The height and extent of billowing smoke plumes from bushfires near Canberra, the Australian capital, are illustrated by these views from NASA's Terra spacecraft acquired on January 18, 2003.
6145-44557575
This image of the Pacific Ocean was produced using sea surface height measurements taken by NASA's U.S./French TOPEX/POSEIDON satellite.
6145-45116980
NASA's SMAP radiometer instrument measured Hurricane Matthew's wind speeds at 4:52 a.m. PDT (7:52 a.m. EDT) at up to 132 miles per hour (59 meters per second).
6145-44675667
The Atmospheric Infrared Sounder (AIRS) instrument on NASA's Aqua spacecraft is also being used by scientists to observe atmospheric carbon dioxide.
6145-44526830
Fire season in Manitoba, Canada lasts from April until October, and numerous smoke plumes caused by lightning strikes are captured in these from views NASA's Terra satellite of the northwestern part of the province; data were acquired on June 20, 2001.
6145-58971717
These three maps based on satellite data show sea levels in the Pacific Ocean during developing El Niño events in early October of 1997, 2015, and 2023. Higher-than-average ocean heights are shown in red and white, while lower-than-average heights are blue and purple. The two earlier maps represent the two extreme El Niño events from the past 30 years - the first from 1997 to 1998 and the second from 2015 to 2016. Both caused shifts in global air and ocean temperatures, atmospheric wind and rainfall patterns, and sea level. El Niños are characterized by higher-than-normal sea levels and warmer-than-average ocean temperatures along the equatorial Pacific. Water expands as it warms, so sea levels tend to be higher in places with warmer water. These temperature and sea level conditions can then propagate poleward along the western coasts of the Americas. El Niños can bring wetter conditions to the U.S. Southwest and drought to regions in the western Pacific, including Indonesia. Not all E
6145-44496732
This image shows wind speeds and direction in the Pacific Ocean on August 1, 1999, gathered by NASA's Seawinds radar instrument flying onboard NASA's QuikScat satellite.
6145-44576977
Observations by NASA's Mars Odyssey spacecraft show a global view of Mars in low energy, or thermal, neutrons. Thermal neutrons are sensitive to the presence of hydrogen and the presence of carbon dioxide, in this case 'dry ice' frost.
6145-44565866
This image of the Pacific Ocean was produced using sea-surface height measurements taken by NASA's U.S.-French TOPEX/Poseidon satellite.
6145-44957379
NASA Airborne Snow Observatory measurements of snow water equivalent (top image) and snow albedo, or reflectivity (bottom image) for the Tuolumne River Basin in California's Sierra Nevada on April 21, 2013.
6145-45264875
This map shows the temperature of the Martian atmosphere 16 miles above the surface. The data was taken on Nov. 18, 2018, about one week before NASA's InSight lander is scheduled to touchdown on the Martian surface. The temperature indicates to mission scientists the amount of dust activity in the atmosphere. The map shows a range of latitudes, with temperatures clearly dropping near the planet's north pole. The landing locations of various NASA Mars landers are shown for context.
1889R-11249
World map
6145-44632986
Typhoon Haitang is shown here churning steadily towards Taiwan and China. This image shows the storm's swirling wind patterns as observed by NASA's QuikScat satellite on July 14, 2005, at 19:19 UTC (14:19 Eastern Daylight Time).
6145-45266412
These images show the mass Greenland's Jakobshavn Glacier has gained from 2016-17, 2017-18 and 2018-19. Areas with the most growth  about 33 yards (30 meters)  are shown in dark blue. Red areas represent thinning. The images were produced using GLISTIN-A radar data as part of NASA's Ocean's Melting Greenland (OMG) mission.
6145-58972024
NASA's Atmospheric Infrared Sounder (AIRS) was monitoring Hurricane Douglas as it took aim at the Hawaiian Islands on July 26. Perched on NASA's Aqua satellite, AIRS is an instrument that studies Earth's weather and climate. As of 11 a.m. local time, Douglas was sweeping toward Hawaii with the potential to directly hit portions of the islands, from Maui to Kauai, in the late afternoon or evening. The purple areas in the AIRS image  taken at 1 53 a.m. local time on July 26  indicate very cold clouds high in the atmosphere generally linked to heavy rainfall. Warmer clouds closer to Earth's surface show up as green and blue, and orange areas indicate cloud-free parts of the sky. The Category 1 hurricane was packing maximum sustained winds of 85 mph (140 kph) on the morning of July 26. Douglas' storm surge is forecast to push water levels as high as 3 feet (0.9 meters) above normal tides. The storm could dump as much as 15 inches (38 centimeters) of rain onto isolated parts of the Hawaiian
6145-44970997
NASA's CloudSat satellite flew over Typhoon Utor in the West Pacific on Aug. 11, 2013 at 0518 UTC, passing within about 6.2 miles (10 kilometers) from the center of the storm, and revealing the structure of the storm's eye and eyewall.
6145-44547937
This hemispheric view of Venus, as revealed by more than a decade of radar investigations culminating in the 1990-1994 Magellan mission, is centered on the North Pole. NASA's Magellan spacecraft imaged more than 98% of Venus.
6145-45112391
The Sand Fire in the Santa Clarita Valley area of Southern California erupted on Friday, July 22, 2016, and rapidly grew to more than 37,000 acres. These images are from the MISR instrument onboard NASA's Terra satellite.
6145-45113417
NASA's Terra satellite passed directly over the island of Madeira on Wednesday, Aug. 10, 2016, where a wildfire spread to the capital city of Funchal.
6145-45099495
NASA's ISS-RapidScat passed over Hurricane Patricia at about 3:00 AM GMT on Oct. 23, 2015. A Hurricane Warning was in effect from San Blas to Punta San Telmo.
6145-44564378
The hemispheric view of Venus, as revealed by more than a decade of radar investigations culminating in NASA's 1990-1994 Magellan mission, is centered at 90 degrees east longitude.
6145-45262490
Scientists with the Advanced Rapid Imaging and Analysis project (ARIA), a collaboration between NASA's Jet Propulsion Laboratory in Pasadena, California, and Caltech, also in Pasadena, used synthetic aperture radar (SAR) data from the European Union's Copernicus Sentinel-1A and -1B satellites, operated by the European Space Agency. They generated a map of the deformation of Earth's surface caused by the Aug. 5, 2018 magnitude 6.9 earthquake under Lombok island, Indonesia. The deformation map is produced from automated interferometric processing of the SAR data using the JPL-Caltech ARIA data system in response to a signal received from the U.S. Geological Survey. The false-color map shows the amount of permanent surface movement that occurred almost entirely due to the quake, as viewed by the satellite, during a 6-day interval between two Sentinel-1 images acquired on July 30 and Aug. 5, 2018. The map shows that the earthquake fault was under the northwest corner of Lombok island, prob
6145-44561771
This series of six images shows the movement of atmospheric water vapor over the Pacific Ocean during the formation of the 1997 El Nio condition.
6145-44631899
Images from the Ozone Monitoring Instrument onboard NASA's Aura spacecraft shows the average total column ozone during the months of January and March, and the total column ozone on the single day of 11 March, 2005.
6145-45297975
The first global geologic map of Saturn's largest moon, Titan, is based on radar and visible and infrared images from NASA's Cassini mission, which orbited Saturn from 2004 to 2017. Black lines mark 30 degrees of latitude and longitude. Map is in Mollweide projection, a global view that attempts to minimize the size or area distortion, especially at the poles (although shapes are increasingly distorted away from the center of the map). It is centered on 0 degrees latitude, 180 degrees longitude. Map scale is 1 20,000,000. In the annotated figure, the map is labeled with several of the named surface features. Also located is the landing site of the European Space Agency's (ESA) Huygens Probe, part of NASA's Cassini mission. The map legend colors represent the broad types of geologic units found on Titan plains (broad, relatively flat regions), labyrinth (tectonically disrupted regions often containing fluvial channels), hummocky (hilly, with some mountains), dunes (mostly linear dunes,
6145-54676250
Satellite Data Shows Ground Motion From Mauna Loa Volcano Eruption. On Nov. 27, 2022, Mauna Loa, Earth's largest active volcano, began erupting from the summit caldera inside Hawaii Volcanoes National Park. Scientists with the Advanced Rapid Imaging and Analysis project (ARIA), a collaboration between NASA's Jet Propulsion Laboratory and the California Institute of Technology, which manages JPL for the agency, analyzed synthetic aperture radar images from the Copernicus Sentinel-1 satellites operated by ESA (European Space Agency) to calculate a map of the Earth's ground movement as a result of the eruption. Using images acquired before and after the start of the eruption - Nov. 22 and Dec. 4, 2022, respectively - scientists produced this false-color map showing the amount of ground surface movement, or displacement, the eruption caused. In the map, surface displacements are seen as color contours, or fringes, where each color cycle represents about 2.8 centimeters of surface motion. T
6188-67190653
World Earthquake Map, Seismic Activity Map World Earthquake Map, Seismic Activity Map Copyright: xZoonar.com/AleksandarxVukicevicx 22900861
6145-52930666
California Atmospheric River Storms Captured by NASA's AIRS. Since the start of 2023 California has been drenched by a series of storms being transported by an atmospheric river - a relatively narrow, windy region in Earth's atmosphere that can transport moisture or tiny particles for thousands of miles, much like a river on land moves water. NASA's Atmospheric Infrared Sounder (AIRS) captured the series of storms as they dumped record amounts of rain in some parts of California, caused flooding, and damaged infrastructure. Forecasts say this pattern of storms will continue through the week of Jan. 9. The images show cloud temperatures taken at infrared wavelengths not visible to the human eye. Purple and violet areas are colder, between about minus 82 degrees Fahrenheit and minus 46 degrees Fahrenheit (minus 63 degrees Celsius to minus 44 degrees Celsius), than blue and green regions which are roughly minus 28 degrees Fahrenheit to 26 degrees Fahrenheit (minus 33 degrees Celsius to mi
6145-44570983
This image of the Pacific Ocean was produced using sea-surface height measurements taken by NASA's U.S.-French TOPEX/Poseidon satellite.
6145-44635051
Tropical Storm Katrina is shown here as observed by NASA's QuikScatsatellite on August 25, 2005, at 08:37 UTC (4:37 a.m. in Florida). At this time, the storm had 80 kilometers per hour (50 miles per hour; 43 knots) sustained winds.
6145-45092818
The radar measurements made by NASA's Soil Moisture Active Passive (SMAP) observatory are sensitive to whether land surfaces are frozen or thawed.
6145-44557360
MGS Mars Orbiter Laser (MOLA) Surface Topography of Northern Hemisphere
6145-45121742
On Nov. 5, 2016, the MISR instrument aboard NASA's Terra satellite passed over New Delhi in the nothern portion of the Himalayas, showing thick haze due to extreme air pollution.
6145-44636130
Tropical Cyclone Heat Potential (TCHP) field in the Gulf of Mexico during September 22, 2005. The path of Hurricane Rita is indicated with circles spaced every 3 hours with their size and color representing intensity (see legend).
6145-44685370
Eyes on Iapetus!
6145-44558115
MGS/TES Temperatures
6145-48900266
WASHINGTON (Sept. 10, 2018) An infrared satellite image of North America provided by the Naval Research Laboratory Monterey from the GOES 16 Advanced Baseline Imager showing Tropical Storm Paul in the Pacific Ocean and Hurricane Florence in the Atlantic Ocean.
6188-55550285
Map of gradual formation of land, vintage engraving. Map of gradual formation of land, vintage engraved illustration. Earth before man  1886. Copyright: xZoonar.com/PatrickxGuenettex 10647681
6145-45265419
This image shows Tropical Cyclone Fani just off the east coast of India in the Bay of Bengal. NASA's Atmospheric Infrared Sounder (AIRS) collected the image at about 1 p.m. PDT (4 p.m. EDT) today, May 2. At the time, the cyclone's wind speeds were equivalent to a Category 4 hurricane, with maximum sustained winds of 155 mph (249 kph) and gusts of up to 190 mph (306 kph), according to the Joint Typhoon Warning Center. The cyclone is expected to make landfall on Friday, May 3. AIRS, in conjunction with the Advanced Microwave Sounding Unit (AMSU), senses emitted infrared and microwave radiation from Earth to provide a 3D look at weather and climate. The infrared image shows temperatures of the clouds or surface. The large purple area indicates very cold clouds carried high into the atmosphere by deep thunderstorms. Warmer areas, including the eye of the cyclone, are shown in blue. Shallower rain clouds appear green, while the orange areas represent mostly cloud-free air moving away from t
6145-58967116
Tropical Storm Emily continues its march toward Hispaniola, which it is expected to reach later on Aug. 3. NASA's Aqua spacecraft captured this infrared image 1:53 p.m. EDT on Aug. 3, with the storm located south of Santo Domingo, Dominican Republic.
6145-45077594
Our planet emits energy as thermal infrared radiation at wavelengths we cannot normally see but can feel -- for example, if we stand close to a hot surface. This map is from NASA's ASTER GED.
6145-45084598
This map shows solar-induced fluorescence, a plant process that occurs during photosynthesis, from Aug. through Oct. 2014 as measured by NASA's Orbiting Carbon Observatory-2.
6145-44656114
This infrared image shows Tropical Storm Ernesto over Cuba, from the Atmospheric Infrared Sounder (AIRS) on NASA's Aqua satellite in August, 2006.
6145-45114734
This map, based on data from NASA's ARIA data system (with modiffied Copernicus data), shows the magnitude 6.2 Amatrice earthquake in central Italy.
6145-44808696
NASA's Aura spacecraft sees El Nio's effects on the atmosphere. An El Nio is characterized by an abnormal warming of sea surface temperatures in the equatorial central and eastern Pacific Ocean.
1746-21117820
Radar captures the internal structure of thunderstorm
6145-45092561
With its antenna now spinning at full speed, NASA's new Soil Moisture Active Passive (SMAP) observatory has successfully re-tested its science instruments and generated its first global maps, a key step to beginning routine science operations in May, 2015
6145-45263076
On the morning of Oct. 8, 2018, the NASA Soil Moisture Active Passive (SMAP) Radiometer got a snapshot of Hurricane Michael, which has intensified to a Category 2 hurricane over the warm waters of the Gulf of Mexico. The radiance acquired by the SMAP L-band Microwave Radiometer can see through clouds and rains, and is sensitive to the extreme ocean surface winds under a tropical storm or hurricane. Areas in red represent higher wind speeds; areas in blue have lower wind speeds.
6145-44629827
As it passed over Antarctica on December 16, 2004, NASA's Terra satellite captured this image showing a wavy pattern in a field of white.
6145-45258645
Phytoplankton growth in the Bay of Biscay intensified in early May, 2013, painting the deep blue waters with huge swirls of jewel-tone colors that were brilliantly visible from space. The Moderate Resolution Imaging Spectroradiometer (MODIS) aboard NASAs Terra satellite captured this true-color image on May 4, 2013. Each year, typically from March through April, such blooms occur in the Bay of Biscay. By May, however, conditions are not as favorable and the blooms tend to fade, then disappear. This bloom is expanding in early May this year, but will likely begin to diminish soon.
6145-45266923
An infrared image of Hurricane Dorian, as seen by the AIRS instrument aboard NASA's Aqua satellite at 1 30 p.m. EDT (10 30 a.m. PDT) on Aug. 29, 2019. The large purple areas are cold clouds, carried high into the atmosphere by deep thunderstorms. Blue and green show warmer areas with less rain clouds, while orange and red represent mostly cloud-free air.
6145-45298253
TEMPEST-D  a weather-observing satellite the size of a cereal box  captured imagery of Hurricane Dorian off the coast of Puerto Rico in the early morning hours (local time) of Aug. 28, 2019. At a vantage point 250 miles (400 kilometers) above the storm, the CubeSat used its miniaturized radio-wave-based instrument to see through the clouds, revealing areas with strong rain and moisture being pulled into the storm. The green colors show moisture spiraling into the storm's center, and the yellow to pink colors correspond to the most intense rainfall. TEMPEST-D  short for Temporal Experiment for Storms and Tropical Systems Demonstration  is an experiment in shrinking weather satellites to a size that makes them inexpensive enough to produce in multiples. The goal is eventual real-time storm coverage with many small satellites that can track storms around the world.
6145-44529695
The 2001 Great Dust Storms - Daedalia/Claritas/Syria Dust Plumes
6145-58971769
The illustration above shows sea levels off the coasts of Peru and Ecuador on Aug. 12, 2023, and Oct. 3, 2023. The Surface Water and Ocean Topography (SWOT) satellite collected the ocean data during its operational phase, which began in late July. The red and orange colors represent sea levels that are higher than average (units are in meters), while green and blue indicate sea levels that are lower than average. The SWOT data shows some of the development of an El Niño along the west coast of the Americas. The SWOT science team made the measurements using the spacecraft's Ka-band Radar Interferometer (KaRIn) instrument. With two antennas spread 33 feet (10 meters) apart on a boom, KaRIn produces a pair of data swaths (tracks visible in the animation) as it circles the globe, bouncing radar pulses off the water's surface to collect surface-height measurements. Launched on Dec. 16, 2022, from Vandenberg Space Force Base in central California, SWOT is now in its operations phase, measuri
6145-45071150
NASA's UAVSAR studies ground deformation after a magnitude 6.0 South Napa earthquake on August 24, 2014.
6145-44525750
This image from NASA's Terra satellite of Diamond Valley Lake Reservoir, near the city of Hemet in Riverside County, billed as the largest earthworks construction project in U.S.history.
6145-44648485
NASA's CloudSat image of a horizontal cross-section of tropical clouds and thunderstorms over east Africa.
6145-45092846
Using a combination of GPS-measured ground motion data, satellite radar data, and seismic observations, scientists have constructed preliminary estimates of how much April 25, 2015, magnitude 7.8 Gorkha earthquake in Nepal moved below Earth's surface.
6145-51396588
State of Louisiana, highlighting low-lying areas derived from USGS digital elevation data , Louisiana, Relief models, Maps Norman B. Leventhal Map Center Collection
6145-51388072
State of Louisiana, highlighting low-lying areas derived from USGS digital elevation data , Louisiana, Relief models, Maps Norman B. Leventhal Map Center Collection
6145-44962652
This plot shows the concentration of carbon dioxide in Earth's mid-troposphere at various latitudes as measured by NASA's Aqua satellite. The colored lines represent different latitude bands that circle Earth, called 'zones'.
6145-45264010
GRACE-FO has completed its first mission phase and demonstrated the performance of the precise ranging system that enables its measurements of how mass migrates around Earth. Along the satellites' ground track (top), the inter-spacecraft distance between them changes as the mass distribution underneath (i.e., from mountains, etc.) varies. The small changes measured by the Microwave Ranging Instrument (middle) agree well with topographic features along the orbit (bottom).
6145-44962651
This graph made with data from the AIRS instrument on NASA's Aqua satellite shows the concentration of carbon dioxide in Earth's mid-troposphere, located roughly between 3 to 6 miles (5 to 9 kilometers) in altitude.
PREVIOUS
of 1
NEXT
2401 S. Ervay, Suite 206
Dallas, Texas 75215
United States
Browse
CategoriesGalleriesFree Research
For Creators
License Your ContentSuperStock For StudentsFrame of Mind BlogContributor PortalNew Image SpotlightLicense AI Imagery
Resources
About UsLicensingTerms & ConditionsAPI AccessPrivacyPricing
Contact
+1 866 236 0087help@superstock.com Contact form
©2026 SuperStock. All Rights Reserved. -B
This site is protected by reCAPTCHA and Google Privacy Policy and Terms of Service apply.