Population and Demography, Illustration of Population Pyramids Chart or Age Structure Graph with Baby Boomers Generation, Gen X, Gen Y and Gen Z in 2016 to 2020.
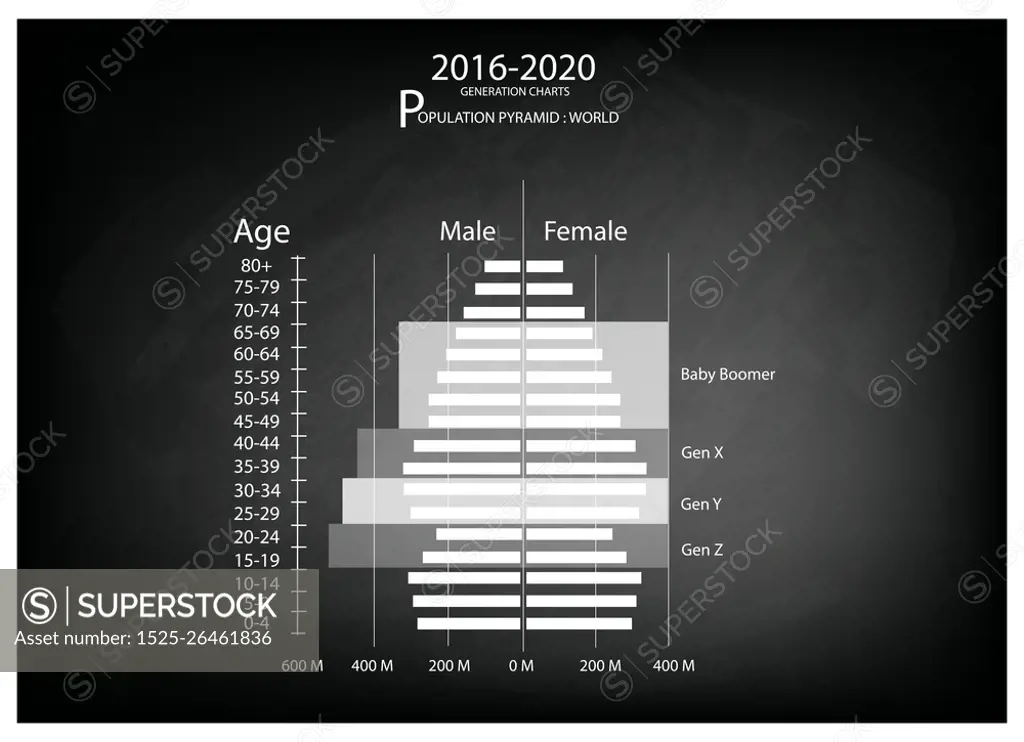
SuperStock offers millions of photos, videos, and stock assets to creatives around the world. This image of Population and Demography, Illustration of Population Pyramids Chart or Age Structure Graph with Baby Boomers Generation, Gen X, Gen Y and Gen Z in 2016 to 2020. by Ingram Publishing is available for licensing today.
Looking for a license?
Click here, and we'll help you find it! Questions? Just ask!
Click here, and we'll help you find it! Questions? Just ask!
DETAILS
Image Number: 1525-26461836Royalty FreeCredit Line:Ingram Publishing/SuperStockCollection:Ingram Publishing Model Release:NoProperty Release:NoType:Vector Image