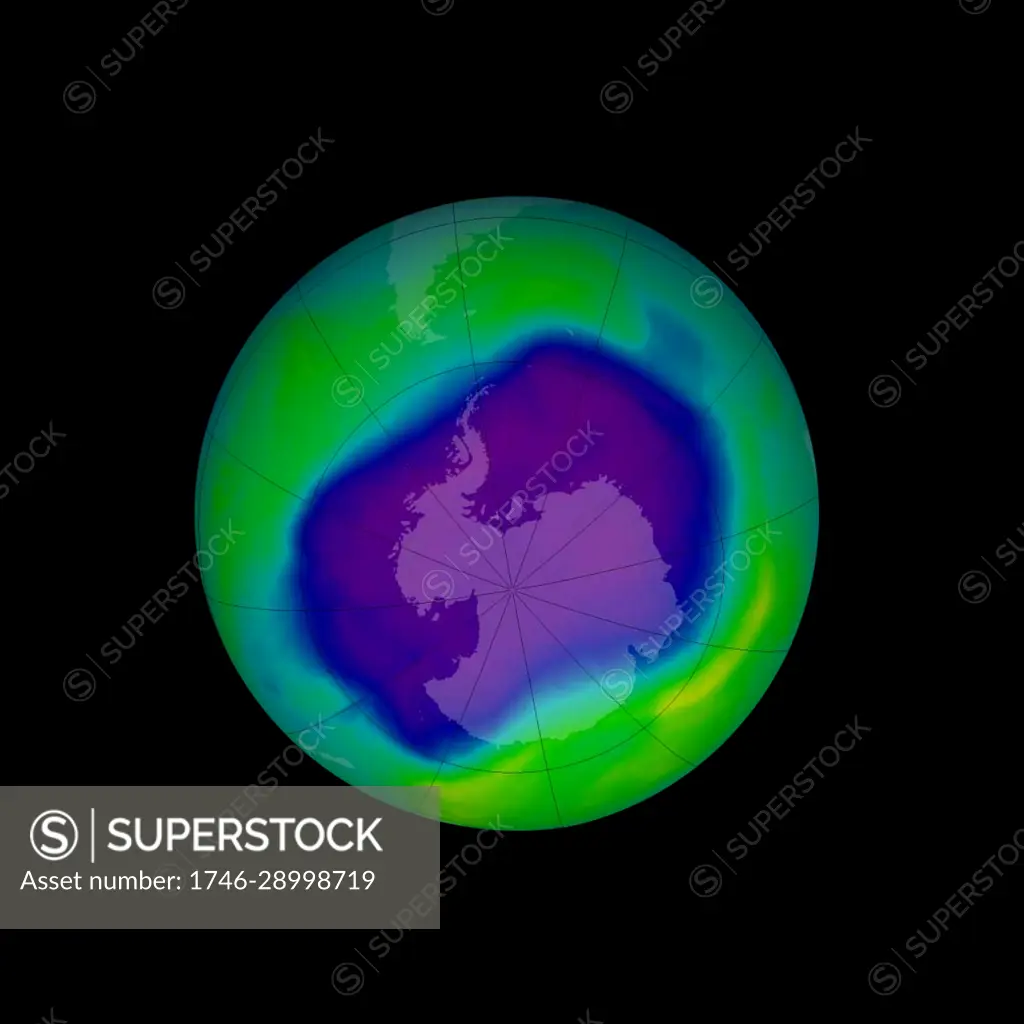
In this image, from September 2006, the Antarctic ozone hole was equal to the record single-day largest area of 11.4 million square miles (29.5 million square kilometres), reached on Sept. 9, 2000. Satellite instruments monitor the ozone layer, and we use their data to create the images that depict the amount of ozone. The blue and purple colours are where there is the least ozone, and the greens, yellows, and reds are where there is more ozone. Ozone depletion describes two distinct but related phenomena observed since the late 1970s: a steady decline of about four per cent in the total amount of ozone in Earth's stratosphere (the ozone layer), and a much larger springtime decrease in stratospheric ozone around Earth's polar regions.
SuperStock offers millions of photos, videos, and stock assets to creatives around the world. This image of In this image, from September 2006, the Antarctic ozone hole was equal to the record single-day largest area of 11.4 million square miles (29.5 million square kilometres), reached on Sept. 9, 2000. Satellite instruments monitor the ozone layer, and we use their data to create the images that depict the amount of ozone. The blue and purple colours are where there is the least ozone, and the greens, yellows, and reds are where there is more ozone. Ozone depletion describes two distinct but related phenomena observed since the late 1970s: a steady decline of about four per cent in the total amount of ozone in Earth's stratosphere (the ozone layer), and a much larger springtime decrease in stratospheric ozone around Earth's polar regions. by Image Asset Management/World History Archive is available for licensing today.
Looking for a license?
Click here, and we'll help you find it! Questions? Just ask!
Click here, and we'll help you find it! Questions? Just ask!
DETAILS
Image Number: 1746-28998719Rights ManagedCredit Line:Image Asset Management/World History Archive/SuperStockCollection:Image Asset Management Model Release:NoProperty Release:NoResolution:4579×4579