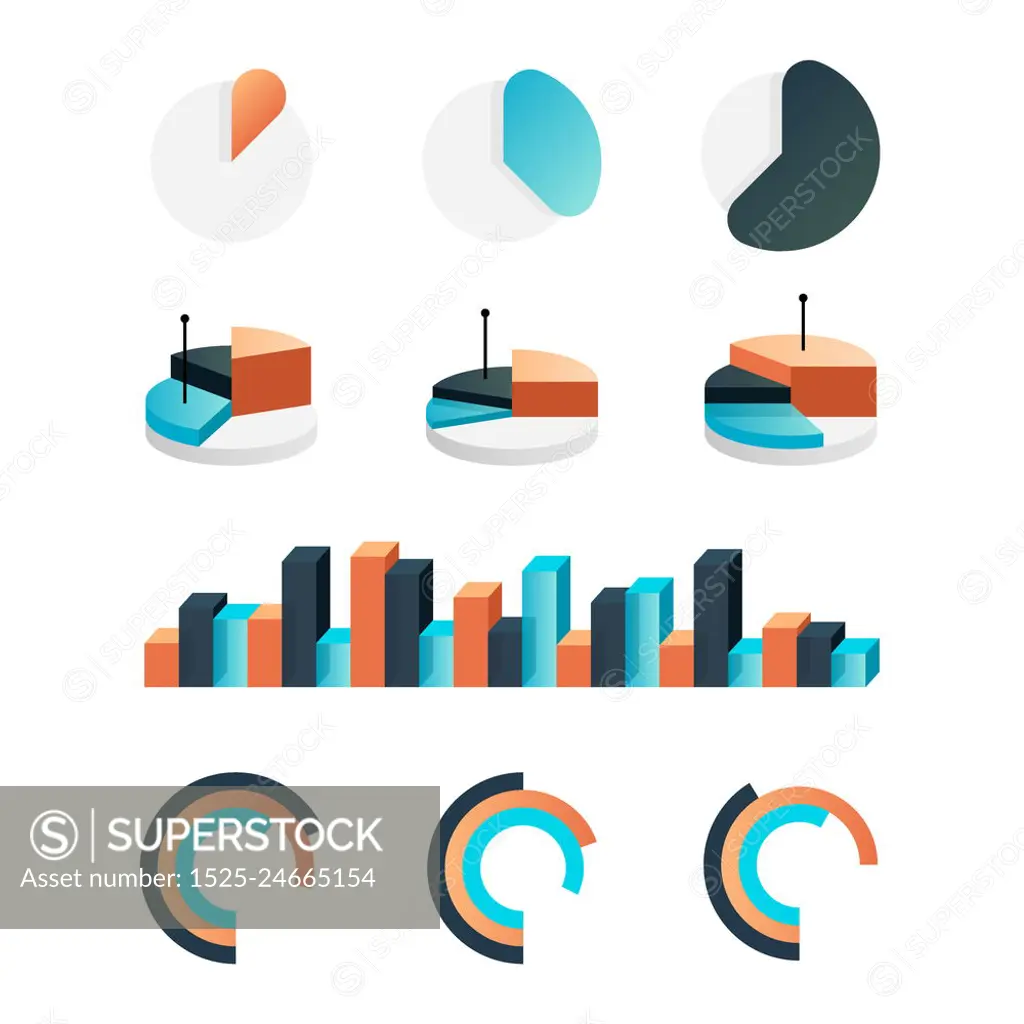
Graphic charts. Infographic statistic bars and circle diagrams for data presentation. Comparison histogram elements. Types set of isolated colorful analytic graphs. Vector information visualization. Graphic charts. Infographic statistic bars and circle diagrams for data presentation. Comparison histogram elements. Isolated analytic graph types set. Vector information visualization
SuperStock offers millions of photos, videos, and stock assets to creatives around the world. This image of Graphic charts. Infographic statistic bars and circle diagrams for data presentation. Comparison histogram elements. Types set of isolated colorful analytic graphs. Vector information visualization. Graphic charts. Infographic statistic bars and circle diagrams for data presentation. Comparison histogram elements. Isolated analytic graph types set. Vector information visualization by Isignstock Contributors/Ingram Publishing is available for licensing today.
Looking for a license?
Click here, and we'll help you find it! Questions? Just ask!
Click here, and we'll help you find it! Questions? Just ask!
DETAILS
Image Number: 1525-24665154Royalty FreeCredit Line:Isignstock Contributors/Ingram Publishing/SuperStockCollection:Ingram Publishing Contributor:Isignstock Contributors Model Release:NoProperty Release:NoType:Vector Image