Fishbone diagram Ishikawa methodology infographic scheme cause and effect.
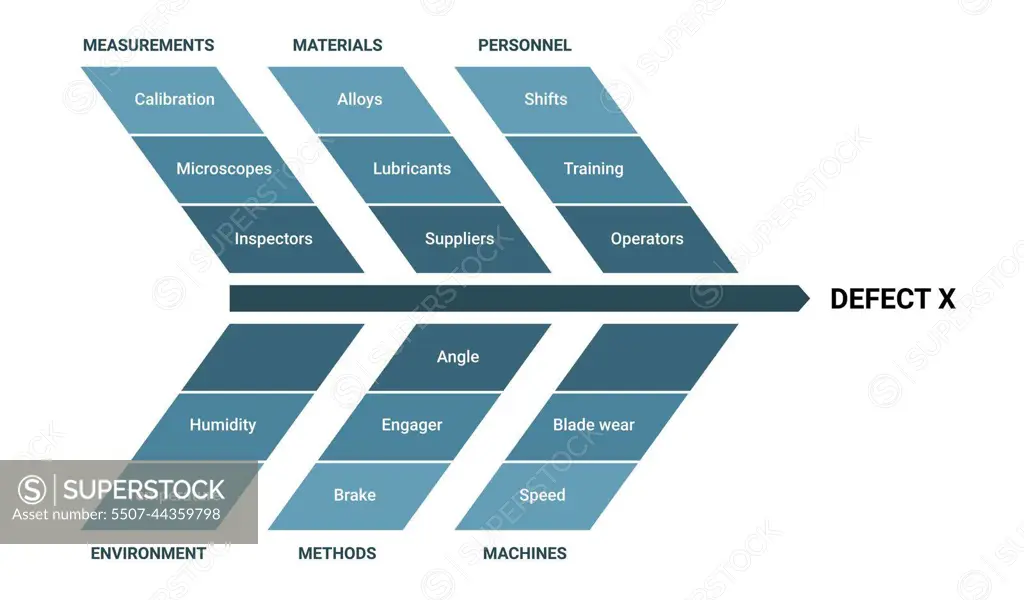
SuperStock offers millions of photos, videos, and stock assets to creatives around the world. This image of Fishbone diagram Ishikawa methodology infographic scheme cause and effect. by Litteralis/YayImages/YAY Images is available for licensing today.
Looking for a license?
Click here, and we'll help you find it! Questions? Just ask!
Click here, and we'll help you find it! Questions? Just ask!
DETAILS
Image Number: 5507-44359798Royalty FreeCredit Line:Litteralis/YayImages/YAY Images/SuperStockCollection:YayImages Contributor:Litteralis Model Release:NoProperty Release:NoType:Vector Image