Computer screen clock and line graph in blue tones. Ideal for data analysis, productivity, monitoring, performance, efficiency, organization, technology. Line metaphor. Digital Analytics Dashboard with Clock and Graph for Time Management and Data Visualization
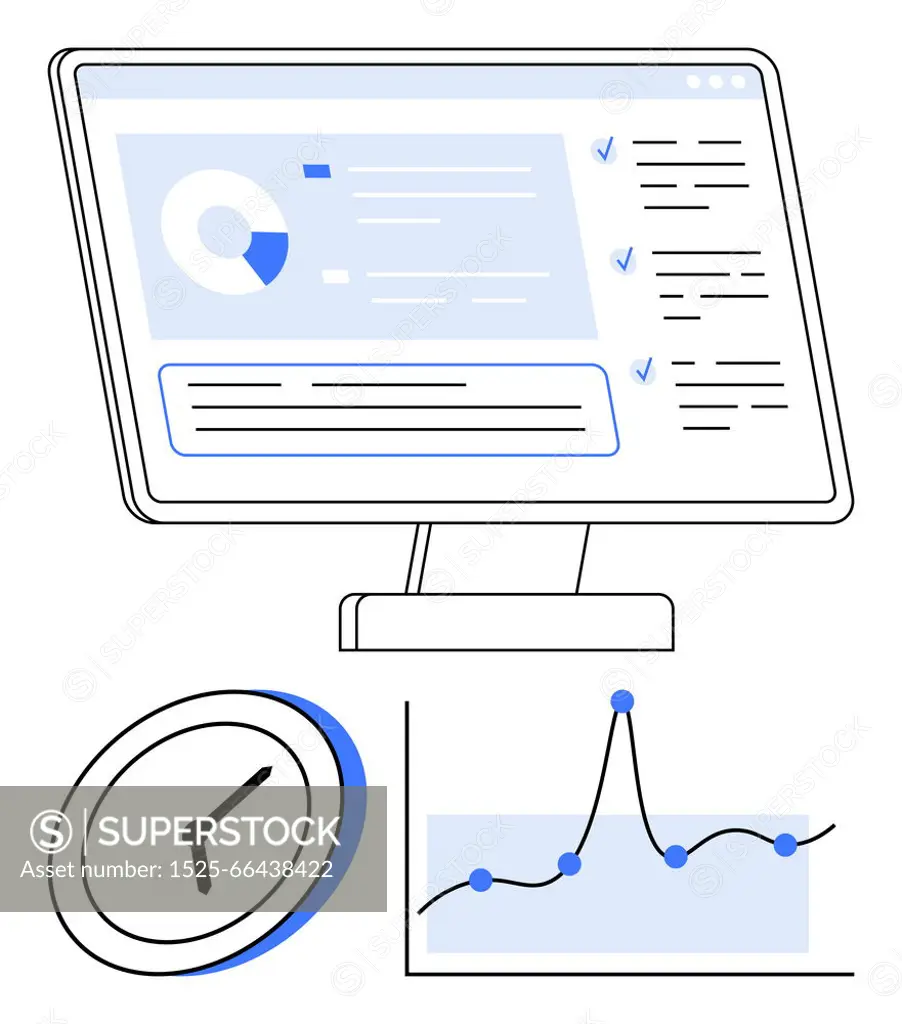
SuperStock offers millions of photos, videos, and stock assets to creatives around the world. This image of Computer screen clock and line graph in blue tones. Ideal for data analysis, productivity, monitoring, performance, efficiency, organization, technology. Line metaphor. Digital Analytics Dashboard with Clock and Graph for Time Management and Data Visualization by Ingimage contributors/Ingram Publishing is available for licensing today.
Visually Similar More from E-commerce Cloud Integration story


Looking for a license?
Click here, and we'll help you find it! Questions? Just ask!
Click here, and we'll help you find it! Questions? Just ask!
DETAILS
Image Number: 1525-66438422Royalty FreeCredit Line:Ingimage contributors/Ingram Publishing/SuperStockCollection:Ingram Publishing Story:E-commerce Cloud IntegrationContributor:Ingimage contributors Model Release:NoProperty Release:NoType:Vector Image