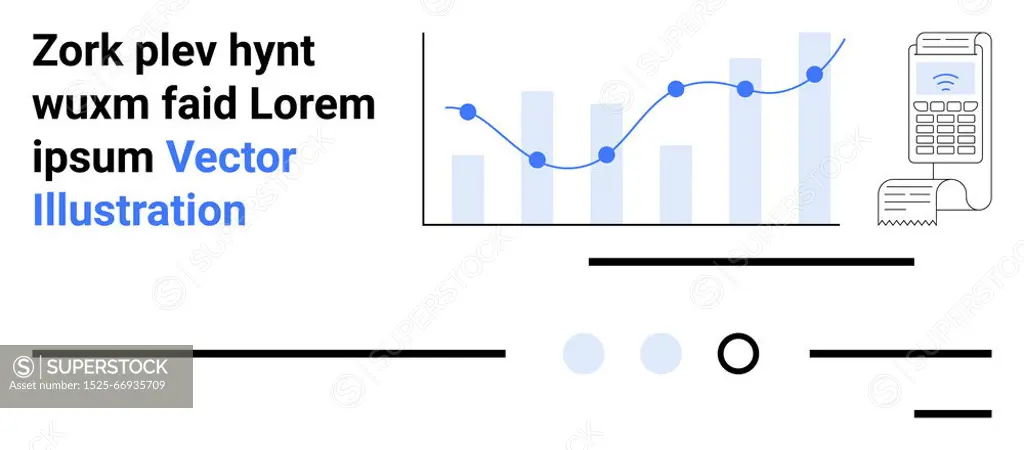
Bar chart with line graph and data points, receipt and calculator, text with call-to-action. Ideal for financial analytics, business reporting, data visualization, market research, economic analysis. Business Analytics Chart with Data Trends and Financial Reporting Elements
SuperStock offers millions of photos, videos, and stock assets to creatives around the world. This image of Bar chart with line graph and data points, receipt and calculator, text with call-to-action. Ideal for financial analytics, business reporting, data visualization, market research, economic analysis. Business Analytics Chart with Data Trends and Financial Reporting Elements by Ingimage contributors/Ingram Publishing is available for licensing today.
Looking for a license?
Click here, and we'll help you find it! Questions? Just ask!
Click here, and we'll help you find it! Questions? Just ask!
DETAILS
Image Number: 1525-66935709Royalty FreeCredit Line:Ingimage contributors/Ingram Publishing/SuperStockCollection:Ingram Publishing Contributor:Ingimage contributors Model Release:NoProperty Release:NoType:Vector Image